How was this made?
Using python, QGIS and CartoDB to visualize the accumulation of trash during moving week
Crunching the numbers
I explored the code enforcement violations, 311 service requests and crime reports using Python, pandas and jupyter notebooks. You can see the specific methods here.
The decision of which violations and 311 complaints to include in my analysis was somewhat arbitrary. I focused on categories that correspond with trash stored on residential properties. In the case of code enforcement violations, that meant excluding several types of violations, such as improper storage of trash on commercial properties, violations involving construction sites, etc. I chose to include the following categories:
Code Enforcement violations
- 'Improper storage trash: res',
- 'Illegal dumping < 1 cubic yd'
- 'Trash illegally dump container',
- 'Maint. of Areas Free from Garbage & Rubbish(Common Areas) - In any dwelling, the owner shall be responsible for maintaining in a clean and sanitary condition free of garbage, rubbish, filth all common areas.',
- 'Illegal dumping 1-5 cubic yd.:',
- 'Storage of Garbage & Rubbish-Owner of dwelling w/ 3 units or more/rooming house shall provide as many receptacles needed for garbage as are sufficient. before final collection and be located convenient to the occ that no objectionable odors enter any dwelling',
- 'Illegal dumping w a vehicle',
- 'Maint. of Areas Free from Garbage & Rubbish(Land) - The owner of any parcel of land, vacant or otherwise, shall be responsible for maintaining such parcel of land in a clean and sanitary condition.',
- 'Storage of Garbage & Rubbish - Garbage or mixed garbage and rubbish shall be stored in watertight receptacles with tight-fitting covers. Said receptacles and covers shall be of metal or other durable rodent-proof material ',
- 'Maint. of Areas Free from Garbage & Rubbish(Units) - Occupantof any dwelling unit shall be responsible for maintaining in a clean and sanitary condition and free of garbage, rubbish, other filth or causes of sickness that part of the dwelling which he excusively occupies or controls.',
- 'Conditions Deemed to Endanger or Impair Health or Safety - Failure to provide adequate exits, or the obstruction of any exit, passageway or common area caused by any object, including garbage or trash, which prevents egress in case of an emergency 105 CMR 410.450, 410.451 and 410.452.',
- 'Storage of Garbage & Rubbish - The occupants of each dwelling, dwelling unit, and rooming unit shall be responsible for the proper placement of his garbage and rubbish in the receptacles required in 105 CMR 410.600C
311 complaints
- 'Overflowing or Un-kept Dumpster'
- 'Improper Storage of Trash (Barrels)'
- 'Missed Trash/Recycling/Yard Waste/Bulk Item'
- 'Trash on Vacant Lot'
- 'Illegal Dumping'
Making the map
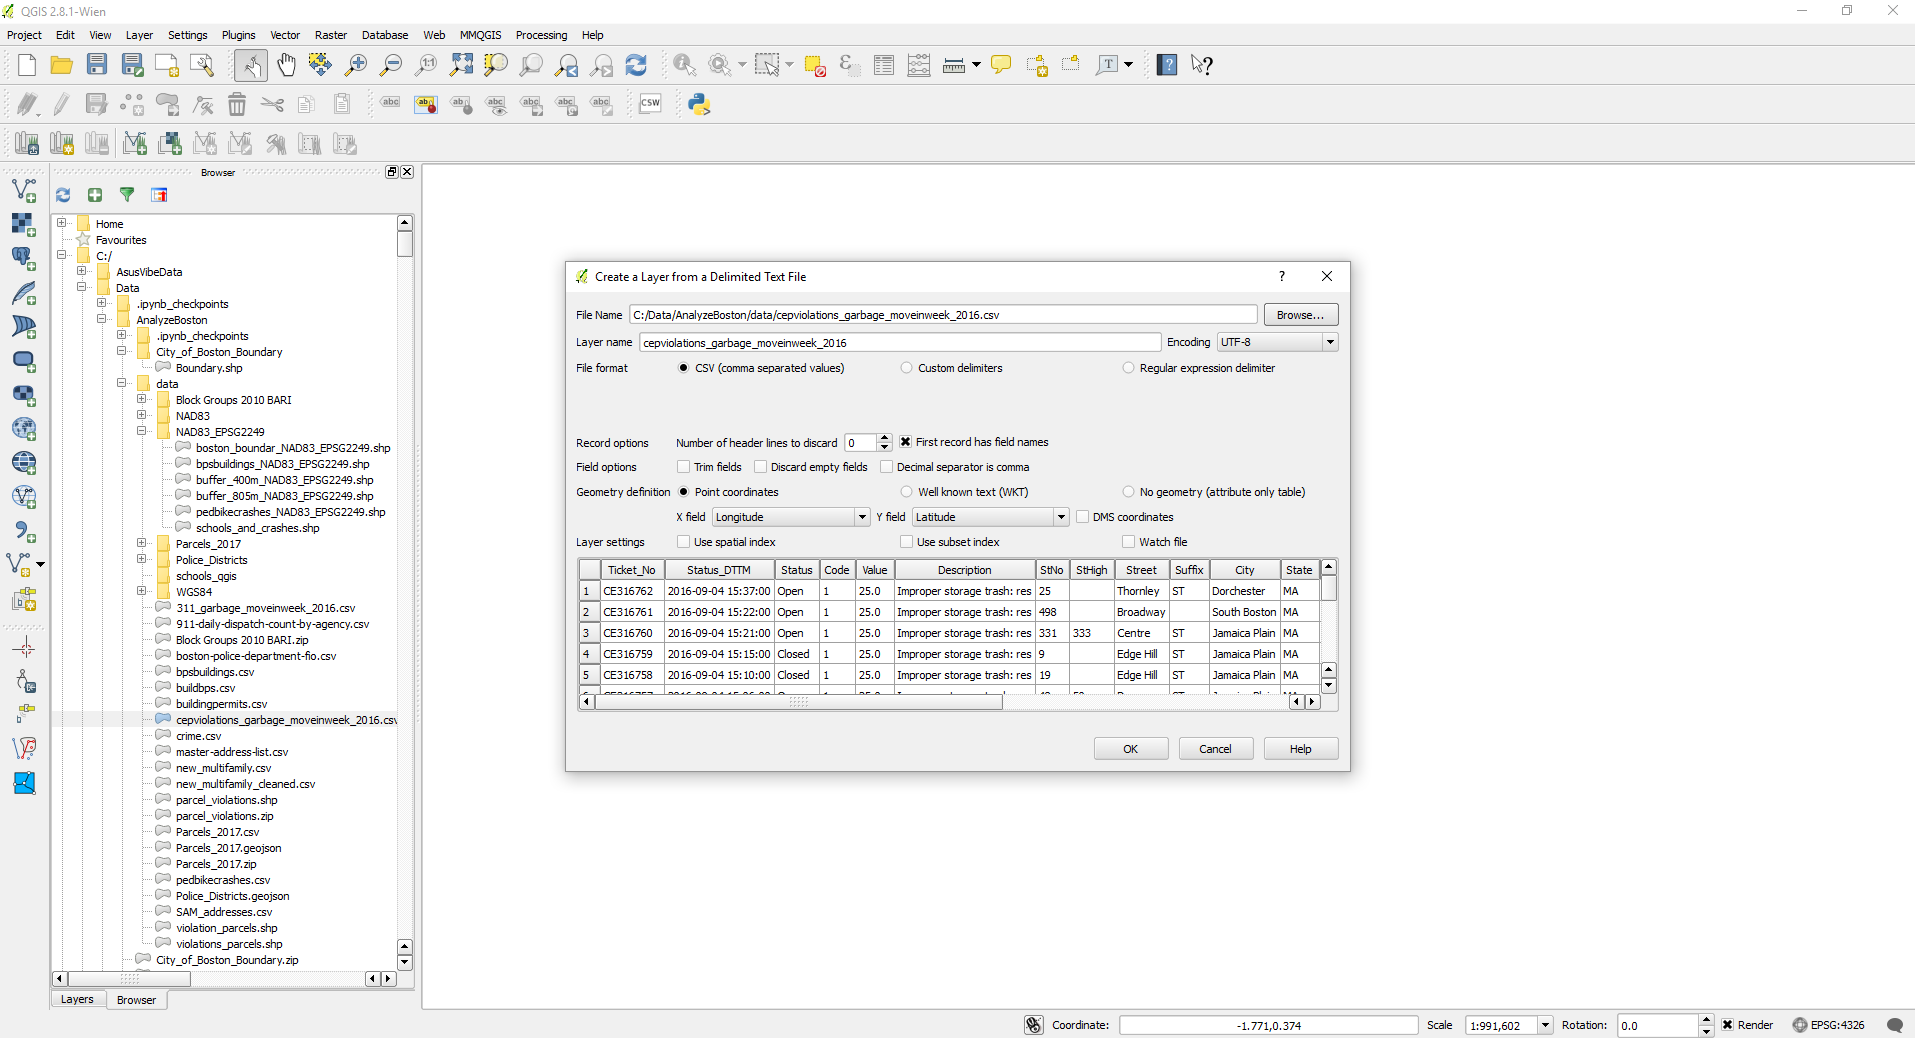
Spatial analysis was accomplished with QGIS. First, I added the csv file containing the list of violations recorded during moving week. Layer -> Add layer -> Add Delimited Text Layer. Select WGS 84 (EPSG:4326) as the CRS.
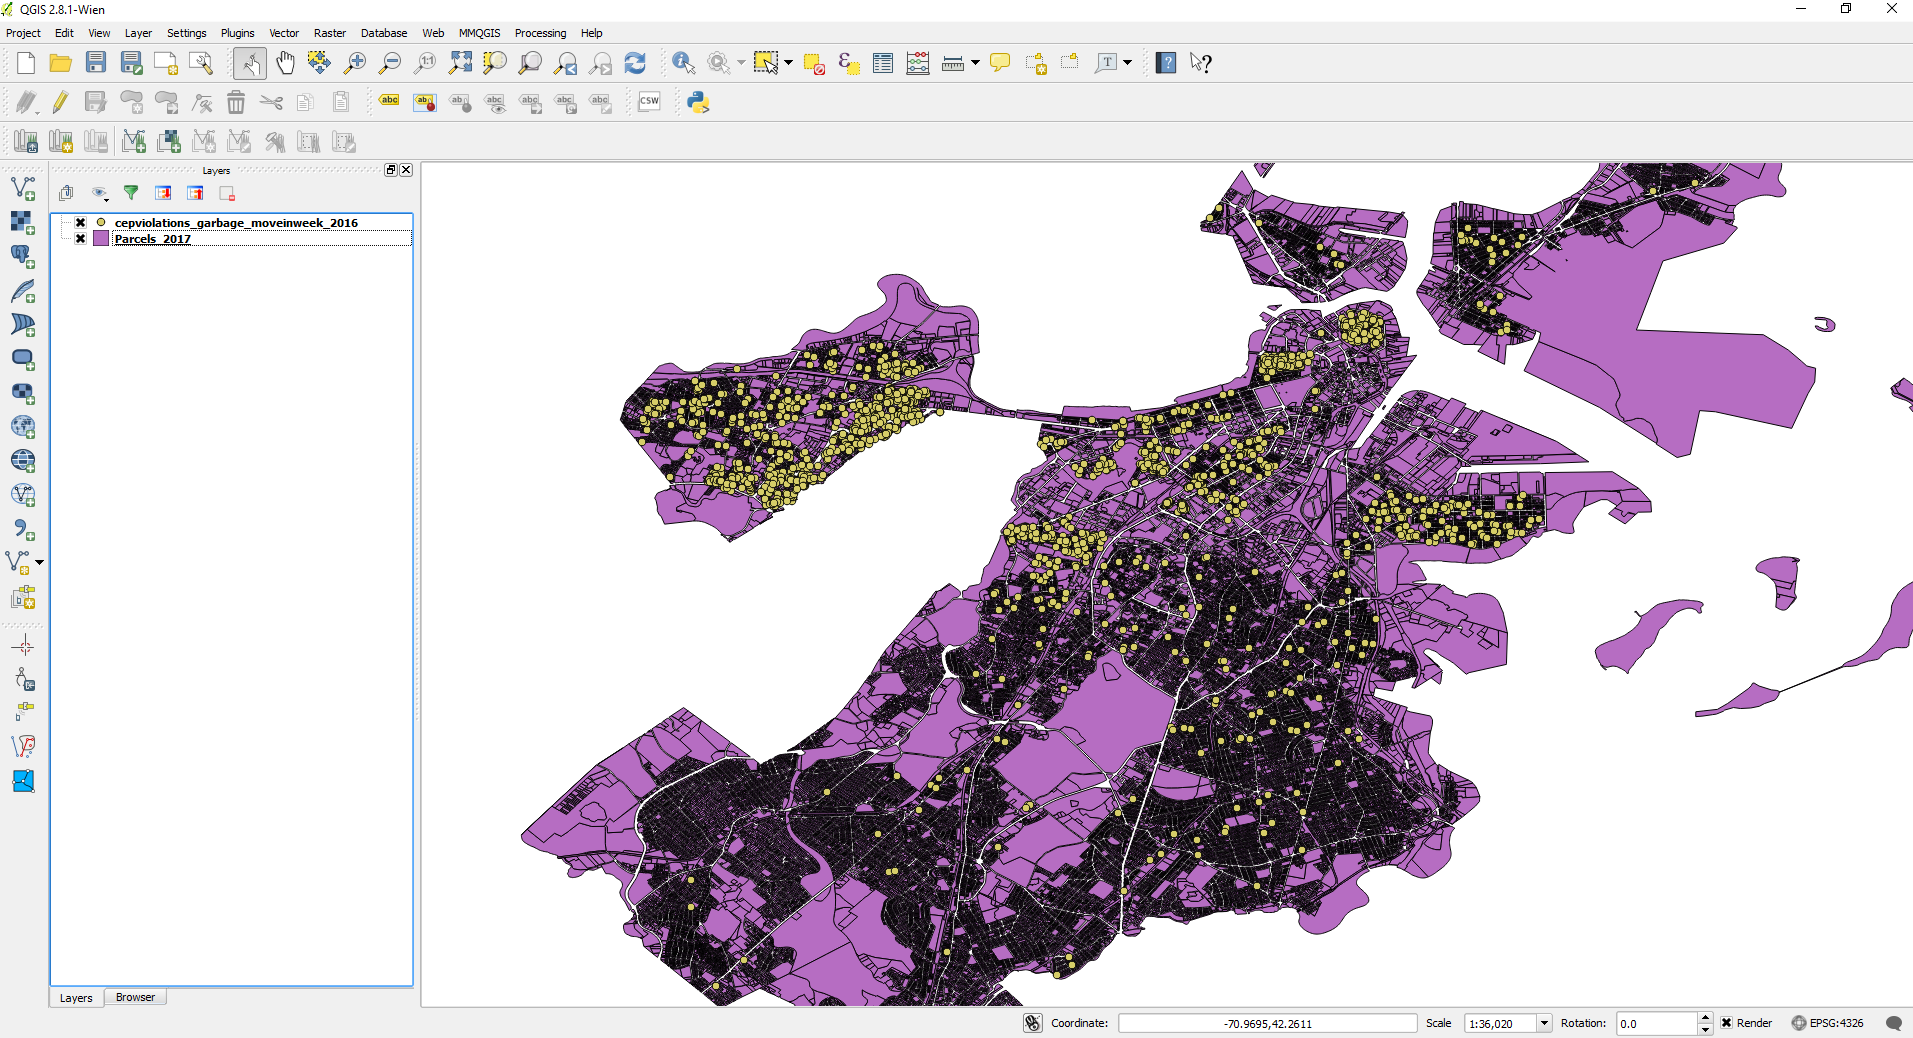
Next, add the ESRI shapefile containing all parcels in the city. From the file browser, click and drag the file onto the map.
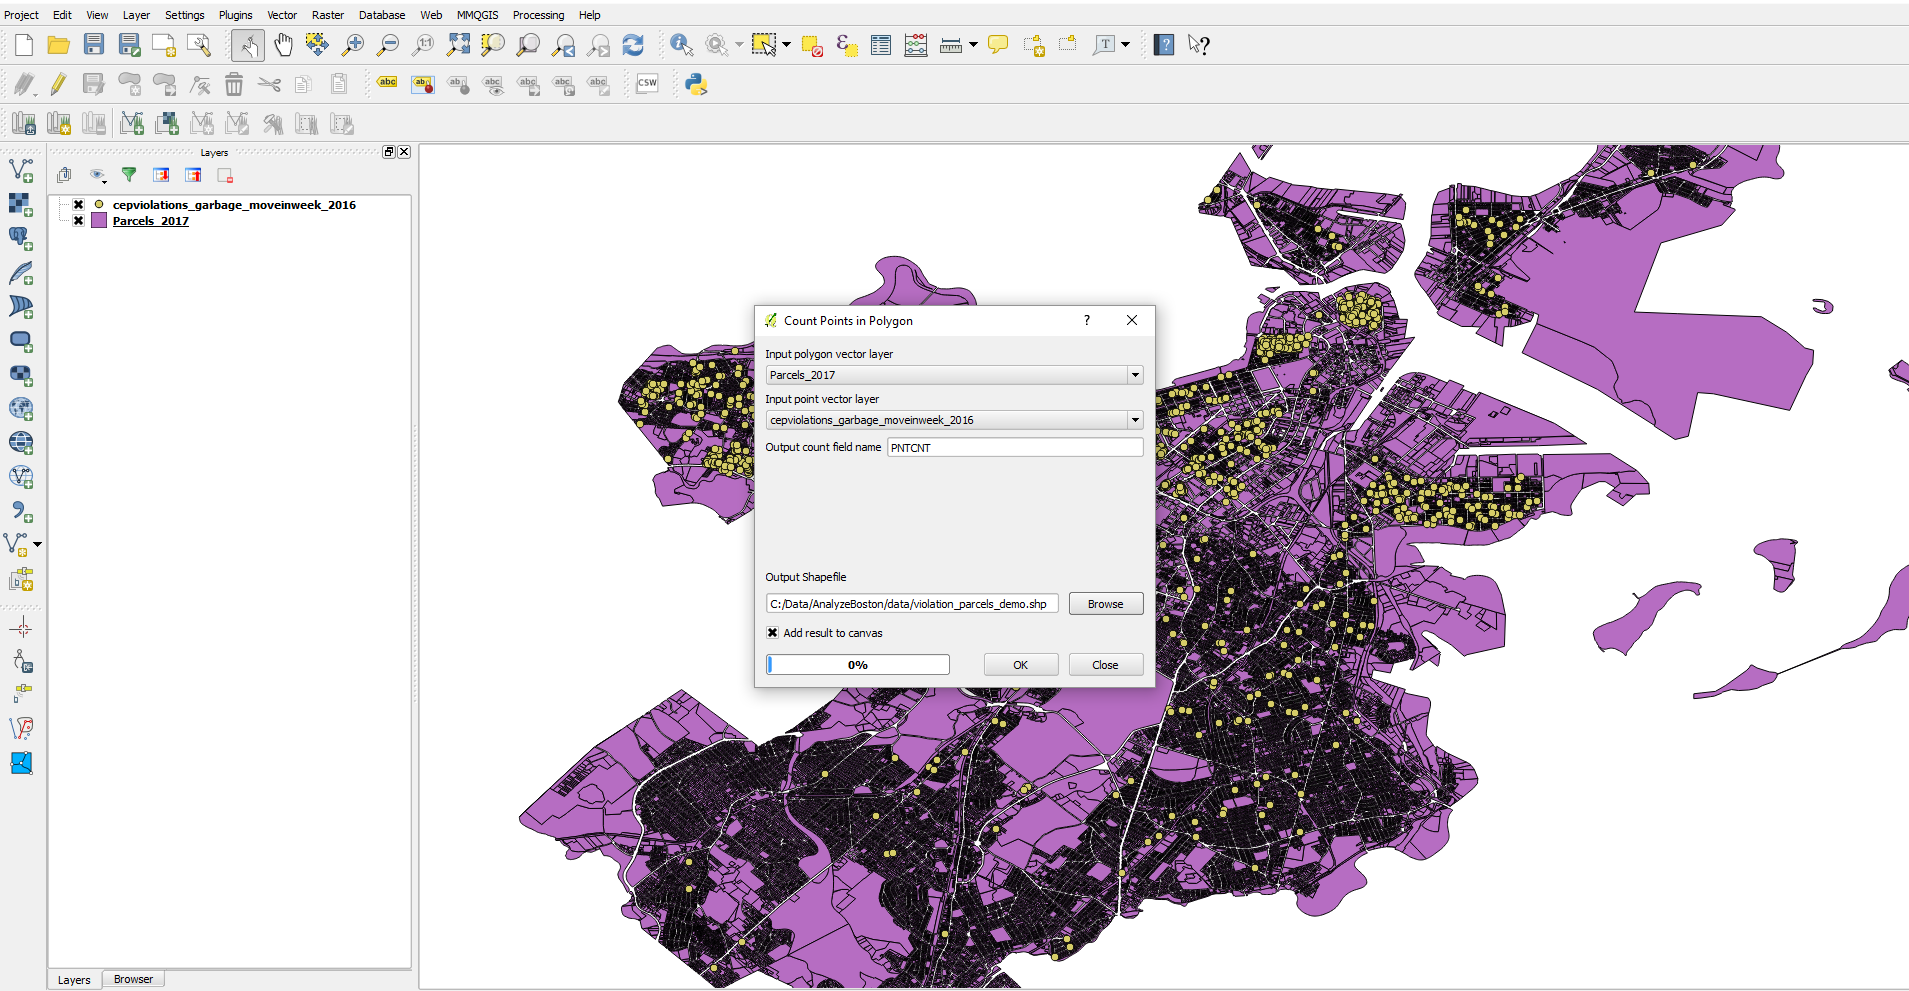
Finally, perform a point in polygon count to calculate the number of violations that were recorded in each parcel. Save the output to a new shapefile. Vector -> Analysis Tools -> Points in Polygon.
I used Carto to create an interactive map. It features three layers: An ESRI shapefile showing the outline of Boston; the new shapefile created in QGIS showing the number of violations in each parcel; and a CSV file of 311 complaints submitted during moving week.
First, to produce an outline of the shape of the city, I imported the Boston boundary shapefile as a new dataset. I reduced the opacity close to 0.0 so it wouldn't stand out too much.
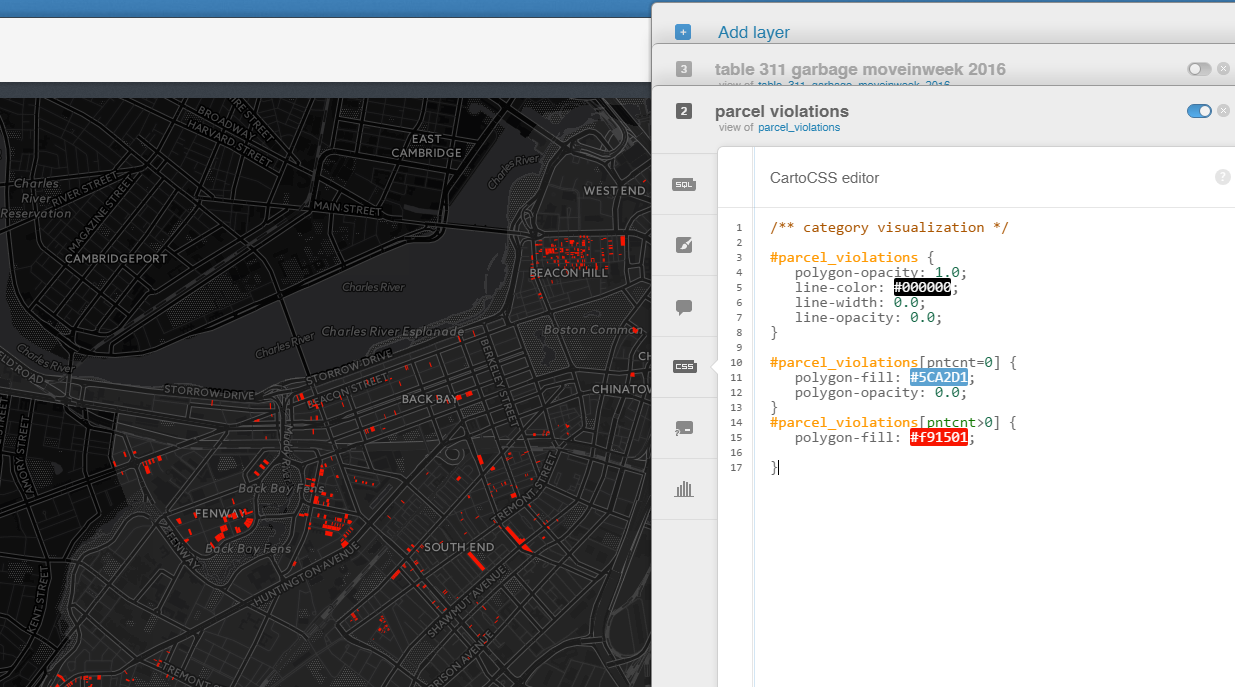
To map the parcels, I uploaded the new shapefile created in QGIS, which includes a "pntcnt" column. It indicates the number of violations recorded in each parcel. In the wizards tab, I selected category visualization. Then in the CartoCSS tab, I applied a few simple rules to style the parcels. Rather than using multiple colors, I decided to color every parcel red if the number of violations was greater than 0. All other parcels are hidden (polygon-opacity: 0).
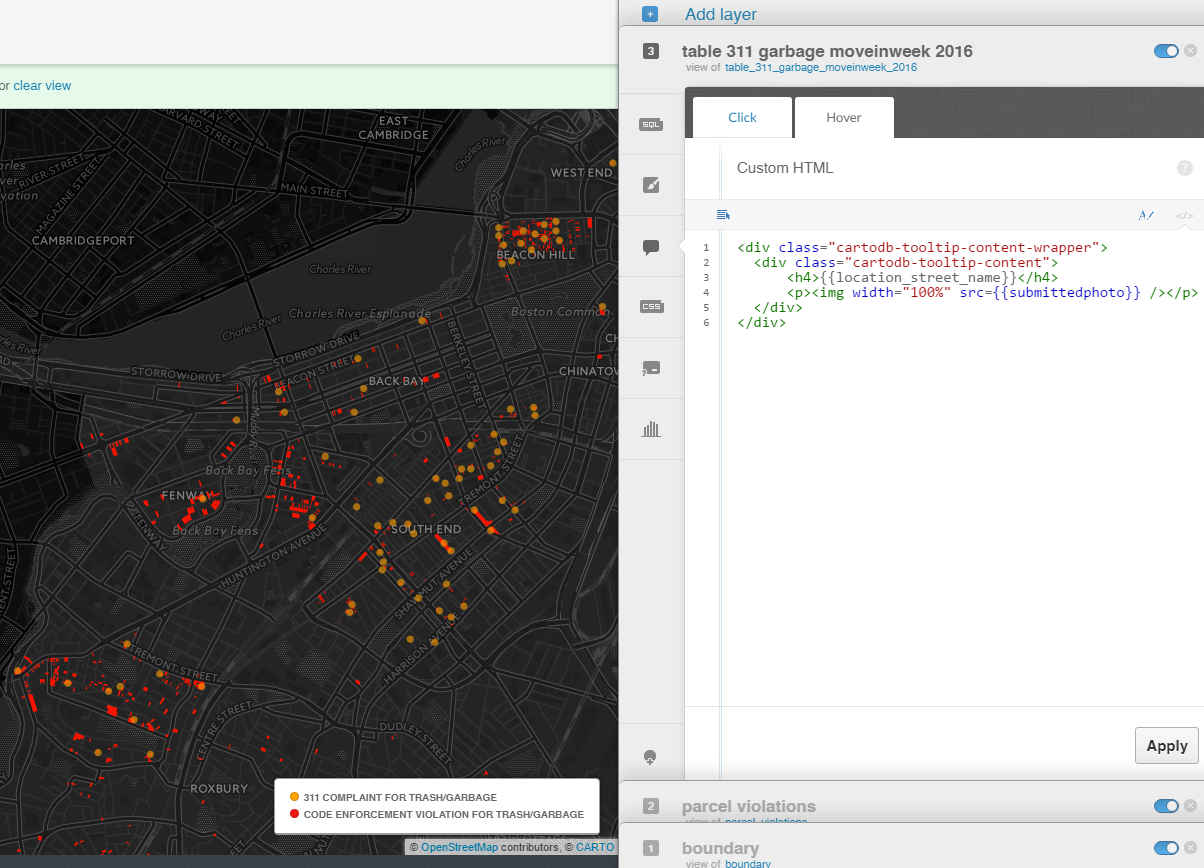
Finally, I added a new layer of 311 complaints. In the wizards tab, I selected simple visualization. I added some additional styling in the CartoCSS tab to change the size and opacity of the points at different zoom levels. The code below displays the photograph submitted with each 311 complaint inside the infowindow. The URL for each photo is saved inside a column called "submittedphoto".